Your express stop for the latest Sound Transit news

A tournament to remember
Seattle’s first experience as a World Cup host city was, in a word, incredible. Hundreds of thousands of fans came out to support nations from around the world – and we saw the best of what our region, and our transit, have to offer.
Preparation pays off
To prepare for the tournament, our staff and partner agencies spent over a year working on projects big and small, so that when match days rolled around, we were ready to step up.
Opening the Crosslake Connection was essential not just to expand access to the Eastside but to double frequencies in the core – and from there we were able to run full peak service across the system from early in the morning until well after midnight on every gameday.
We completed extensive maintenance on both our trains and tracks in the leadup to June, which ensured we could put more light rail vehicles in service than ever before on each of the six matchdays: 174, to be precise. This not only allowed us to move even more people, it also made our system more resilient to delays and disruptions.
Record results
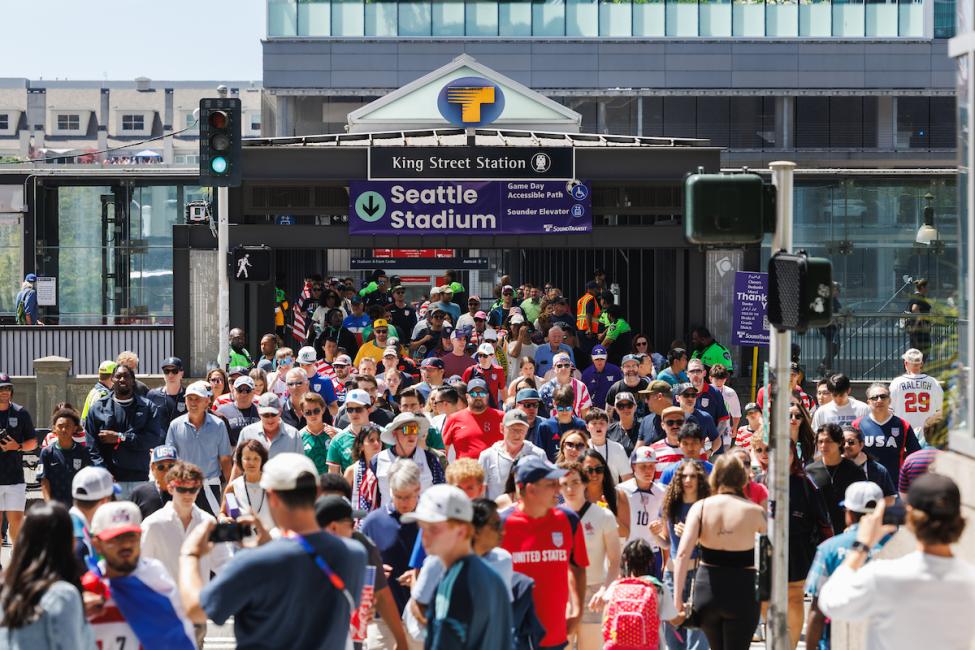
The preliminary results* of all that preparation was a month that surpassed our most ambitious expectations. Link light rail recorded 5.4 million boardings in June, exceeding our previous monthly high by nearly a million rides.
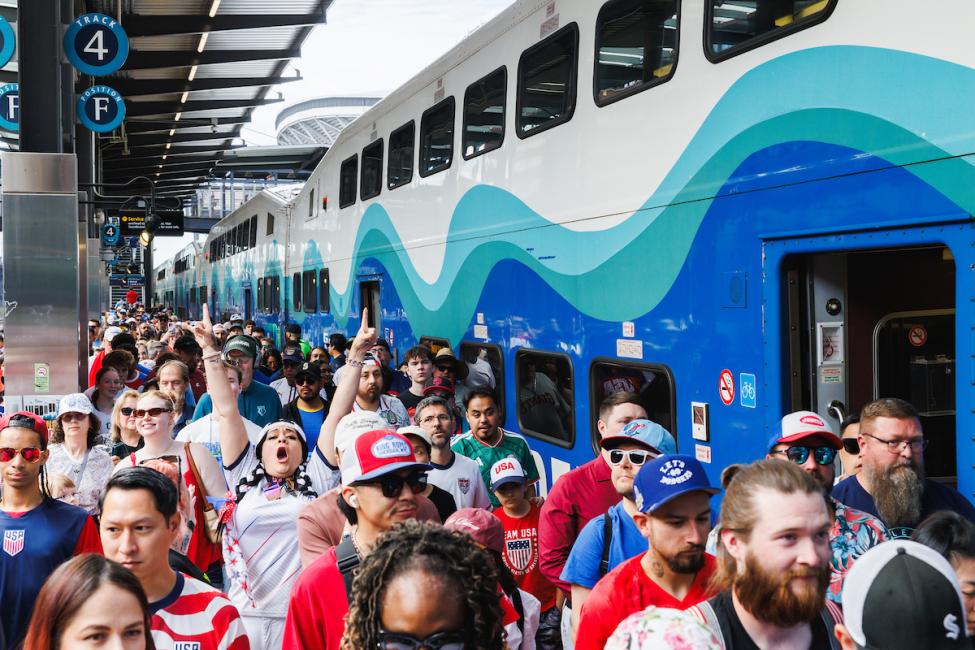
We also saw four of our five busiest days in agency history during the tournament and recorded more than 220,000 boardings seven times – all six match days plus the Thursday before the group stage clash between the U.S. and Australia.
You made this possible
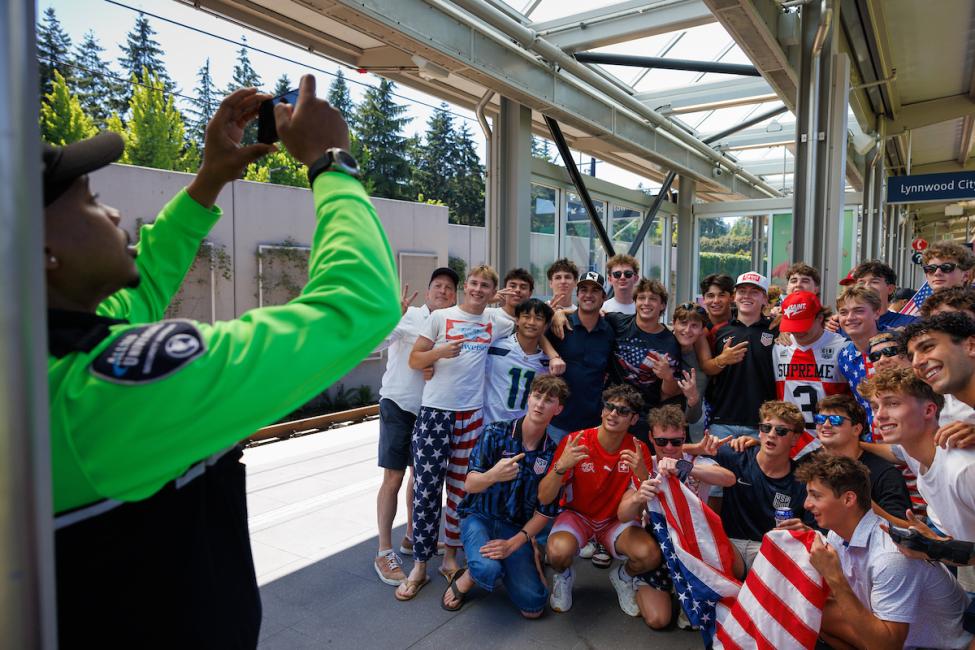
Pulling off four different records in less than a month required a lot of incredible coordination. We are grateful for our partners at King County Metro Rail, our many additional security officers and fare ambassadors, and all of the volunteers working to help our transit system move as one.
Every member of Sound Transit staff also took at least one turn in a teal vest to help guide our passengers through the system, making sure passengers with disabilities could navigate with confidence, guiding game day traffic back to preferred stations, and generally showing off our system – and our region – to visitors from around the globe.
But the real thanks belongs to you – our riders. You were patient with the lines, you were welcoming to our guests, and you made sure we could all set these records, together.
*A note about our numbers
Methodology explanation: Ridership estimates are based on a rapid-turnaround review of available Automatic Passenger Counter (APC) data and should be considered an early directional estimate. Because APC data continues to be received and validated after the operating day, the estimates are derived from a partial reporting sample and extrapolated to the full fleet. The most recent service periods currently have the lowest reporting rates, meaning the estimates may increase or decrease as additional vehicle data is processed and validated.
Why are numbers shifting? Ridership estimates are refined as additional APC data is incorporated into the model. The above numbers represent the latest and most accurate estimates for ridership during both June and the World Cup.